
How much will it cost to meaningfully reduce greenhouse gas (GHG) emissions on a global scale? The answer is critical for assessments of how to address climate change—affecting public support, political will, and policy choices. We find that the “bottom-up” estimation approach emphasized by the United Nations Intergovernmental Panel on Climate Change (IPCC) reports considerably lower costs for emission reductions than leading “top-down” economic models. We also find that one core feature explains the vast majority of the difference: The bottom-up estimates include substantial reductions that appear to come at zero cost, or even at a savings, whereas the economic models assume no such “free lunch.” The fact that different methodological approaches produce different results may not be surprising. But that nearly all of the discrepancy loads on how much mitigation is seemingly costless raises important challenges for understanding and communicating the actual costs of reducing emissions.
We compare two of the leading approaches for estimating marginal mitigation costs: the bottom-up, sector-by-sector approach employed by the IPCC and others, and the top-down approach built into leading integrated assessment models (IAMs) in the climate-economics literature focused on benefit-cost analyses. Research on the “energy efficiency paradox” foreshadows how results may differ between approaches. The paradox arises because adoption rates of energy efficiency investments typically fall short of predictions based on the cost savings estimated by bottom-up, engineering approaches. The reason is that a full accounting of direct and indirect costs is not taken into consideration. This might suggest that the IPCC and other bottom-up approaches understate the full costs of reducing GHG emissions. But there may also be concerns with top-down estimates, as broad analyses of environmental and climate policies find that costs are likely overstated. We therefore find scope for a potential middle ground.
A comparative cost analysis
We focus primarily on the IPCC’s headline costs reported as mitigation potentials in the Summary for Policymakers of Working Group III in the Sixth Assessment Report (1). It is upon these estimates that the IPCC asserts with “high confidence” that global GHG emissions could be reduced by at least half in 2030 at costs less than $100 per tonne of CO2 equivalent (tCO2-eq). For these estimates, the IPCC, as McKinsey & Company famously did over a decade earlier (2), estimated the cost of abatement opportunities bottom-up, sector by sector, and technology by technology.
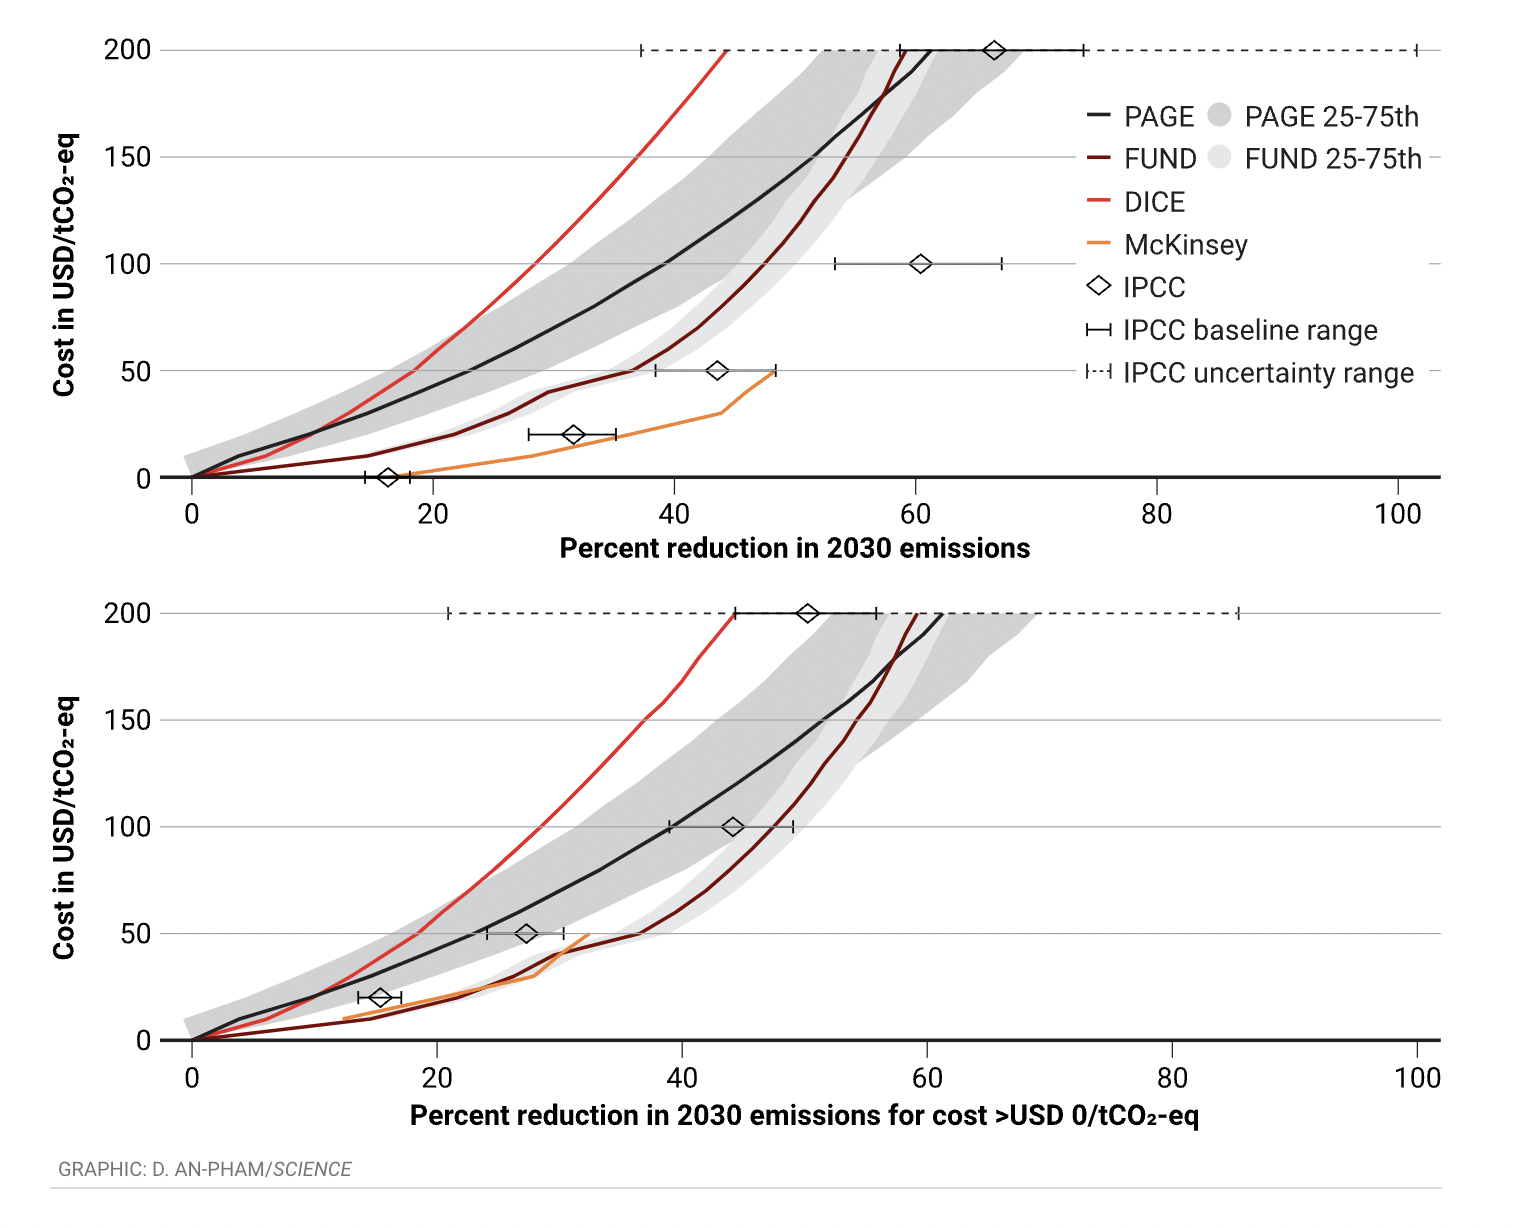
Comparison of global mitigation potentials at different costs
The IPCC results use different baseline emissions to calculate the range of mitigation potentials. The top panel reports the full set of results, and the bottom panel reports only the mitigation potentials with costs >$0 per tonne of CO2 equivalent (tCO2-eq). USD reported in 2020 dollars. See supplementary materials.
The IPCC provides estimates of the 2030 mitigation potential at a range of costs for 43 different activities (e.g., renewable-energy installations, alternative land management strategies, energy-efficient buildings, fuel switching) in six sectors: energy; agriculture, forestry, and other land uses (AFOLU); buildings; transport; industry; and other. The analysis is based on a comparison of net lifetime monetary (“out of pocket”) costs of avoided emissions between particular mitigation activities and a reference technology, where the estimates are based on 175 different sources, many of which are regionally specific. For example, electric vehicles are compared to specific internal combustion engine vehicles on the basis of estimated manufacturing and operating costs, changes in emissions, and assumed adoption rates.
The IPCC results can be used to plot an aggregate marginal cost curve for mitigation (see the first figure, top panel). The marginal cost per tCO2-eq is increasing in the level of aggregate emission reductions, showing that obtaining greater reductions requires more higher-cost activities. Across all sectors, the IPCC estimates the potential for a 32% reduction in GHG emissions in 2030 for activities costing $20 or less per tCO2-eq; that potential increases to 43% at costs up to $50. These findings are not dependent on imposing a policy requiring payment for emissions, such as a carbon tax. Instead, they focus on the technical potential and, for example, imply that a 32% reduction in emissions would occur if all activities costing less than $20 per tonne were to take place.
The IPCC reports potentials for five different cost bins, including one where costs are <$0, which turns costs into savings, at least with respect to the needed monetary expenditures. A saving rather than cost occurs when, for example, the full cost of electric vehicles (including maintenance and operating costs) is estimated to be below that of conventional substitutes, and the former is associated with lower emissions.
We also consider results of the McKinsey cost curve, a useful benchmark because it is so well-known, frequently invoked to justify policy, and a methodologically similar point of reference for the IPCC results. The 2030 mitigation potentials, according to McKinsey’s 2009 estimates, are greater than the IPCC’s 2022 estimates at all costs >$0, but both provide nearly identical estimates that a 16% reduction in GHG emissions in 2030 would result in net monetary savings for the global economy (see the first figure, top panel).
However, there are nonmonetary barriers to the adoption of mitigation activities. For example, even if an electric car is less expensive than a conventional alternative, some people might prefer the alternative for a host of reasons, including performance and familiarity. In these cases, switching to the electric vehicle may no longer be considered a cost savings after accounting for these preferences and trade-offs. In general, barriers to adoption of mitigation and energy- efficient activities include lack of information and capital for higher upfront costs, societal costs and organizational barriers such as the provision of charging stations, uncertainty around a new technology, and behavioral-based rigidities. So how much, then, would it cost to get more people to switch? Taking account of the direct expenses alone is incomplete, but how to include the indirect costs in the accounting—i.e., the full opportunity costs—is less clear and often highly individual specific.
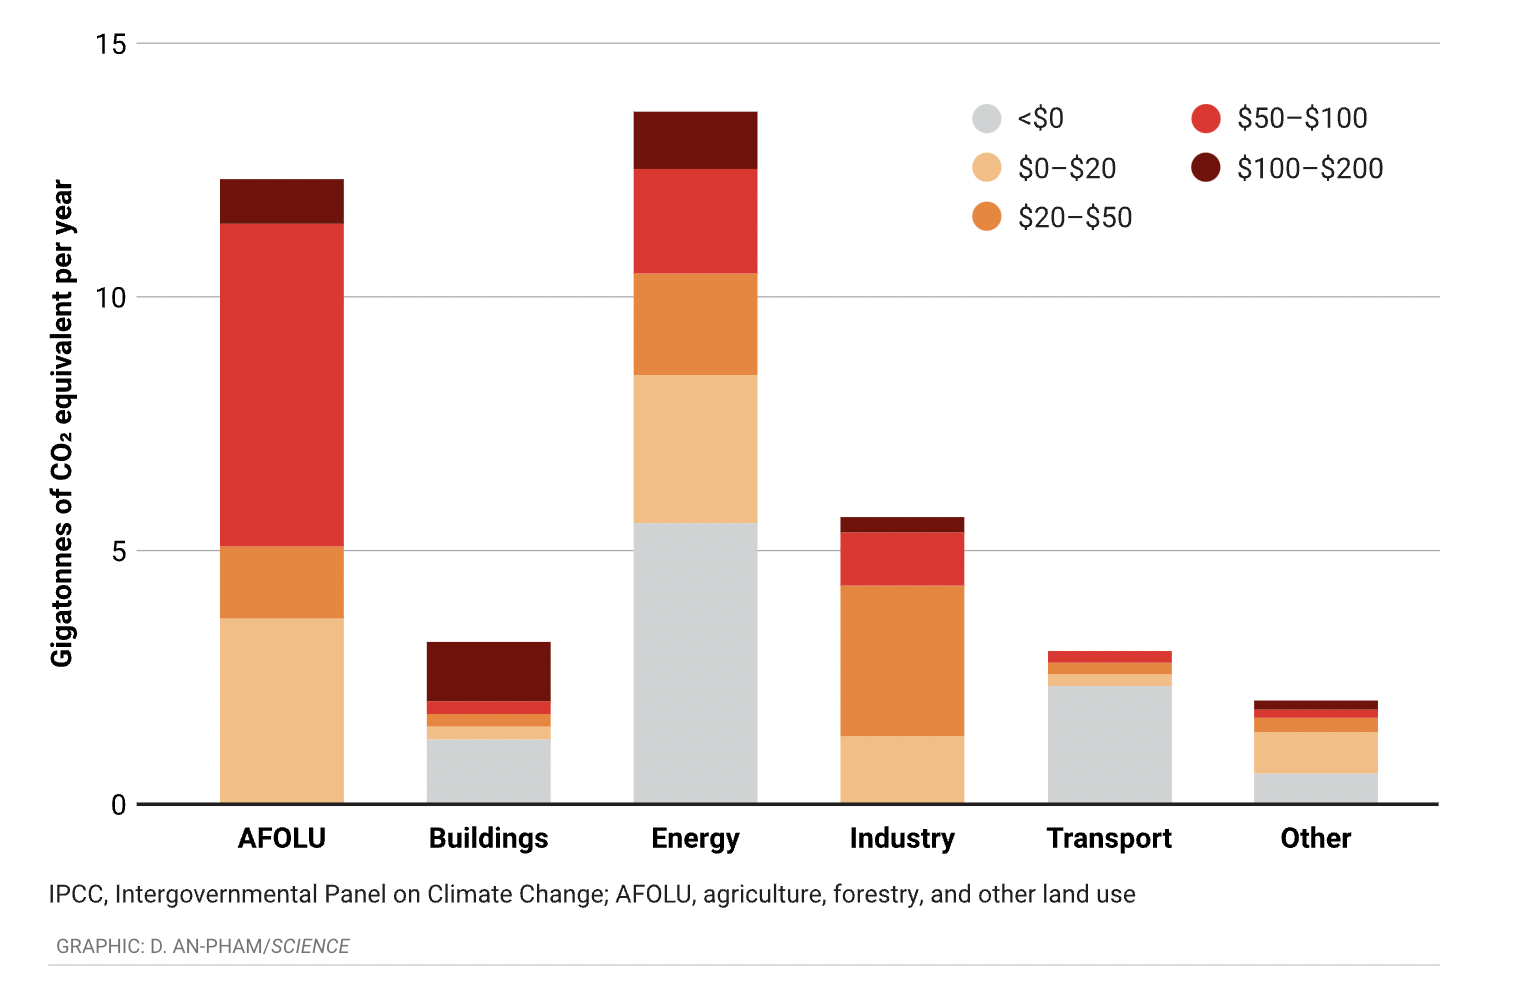
IPCC mitigation potentials in 2030 by sector
Mitigation potential is reported separately for different cost bins. “Other” includes reduced emissions from fluorinated gas and methane from solid waste and wastewater. The sum of these potentials for each bin corresponds with the IPCC point estimates in the first figure. USD reported in 2020 dollars. See supplementary materials.
Although the IPCC acknowledges nonmonetary barriers to the adoption of mitigation activities, they are not taken into account in its bottom-up (and bottom-line) estimates, nor is their omission mentioned in the high-confidence recommendation of what can be accomplished by 2030. Part of the reason is likely that nonmonetary barriers are more difficult to quantify, resulting in less literature on which to draw. Another reason may be to emphasize the potential cost savings, hoping to change preferences and behaviors that create barriers in the first place, thereby lowering their cost. A potential downside of focusing only on direct monetary costs, however, is misleading communication about the full extent of how costly emissions reductions will be.
In contrast to bottom-up, engineering-focused, models, the benefit-cost IAMs take a top-down approach, representing abatement costs as an aggregate function of emission reductions or carbon prices. Because the models capture aggregate global trends, abatement costs are not specified for particular activities. Instead, they capture trade-offs with how abatement activities decrease funding available for other investments that promote economic growth, while also accounting for the benefits of technological learning. For example, a policy that promotes the manufacturing of electric vehicles would mean fewer resources for other productive investments, while also spurring learning and spillovers across regions that lower the cost of future emissions reductions. The net effect of these different impacts, which vary by model, contributes to the marginal costs of reducing emissions. All of the models, however, assume that mitigation activities must be costly, otherwise they would already occur without the need for policy and be included in business-as-usual baselines.
We focus primarily on the three economic IAMs used around the world and traditionally employed by the US government (and other countries) to derive official estimates of climate damages: DICE, FUND, and PAGE. For each, we are able to produce model-based marginal cost curves for GHG emission reductions in 2030 (see supplementary materials). These results can be interpreted equivalently as mitigation potentials (i.e., the percent reduction in GHG emissions compared to a baseline) at different costs and compared directly to those from the bottom-up approaches.
The estimated mitigation potentials of all three IAMs are lower than the bottom-up estimates (see the first figure, top panel), especially below costs of $200 per tCO2-eq. For example, at costs below $50, the mean estimate among the IAMs is a 26% reduction in 2030 compared to 43% for the IPCC. Nevertheless, all three IAM estimates fall within the range of uncertainty based on the IPCC potentials at $200, which is the only level at which uncertainty is reported.
A striking observation is that most of the divergence between approaches is the result of what happens at costs <$0. None of the climate-economic IAMs include any costless mitigation, in contrast to the IPCC and McKinsey curves (see the first figure, top panel). A fundamental insight is that the two approaches send very different messages about the likely costs of emissions reductions less than a decade into the future. Specifically, the IPCC estimates show mitigation potentials approximately twice the magnitude of the mean across the IAMs at costs ranging from $20 to $50.
But when we consider only emission reductions that occur at costs >$0, removing the 16% of costless reductions in the IPCC and McKinsey analyses, the top-down and bottom-up estimates closely match (see the first figure, bottom panel). When thus given the same starting point, the mean mitigation potential across the three IAMs differs from the IPCC estimate by less than 2 percentage points at costs ranging from $20 to $50.
Finally, we consider comparisons to six other IAMs often called “process-based” models because they focus more on bottom-up integration of energy and biophysical systems rather than on benefit-cost analysis. The models that we consider are also used in different portions of the IPCC analysis. We find that these models are more closely aligned with the bottom-up estimates than the benefit-cost IAMs with regard to mitigation potentials and the treatment of costless mitigation (see supplementary materials). This finding is important because whereas the IPCC’s bottom-up analysis acknowledges omission of indirect, nonmonetary costs, the same qualification is typically not associated with policy analysis coming out of the process-based models.
Research needs
We have shown how different starting points on costless mitigation explain the vast majority of the divergence in the IPCC’s bottom-up estimates and top-down economic approaches. But the critical question is: Which starting point is more helpful for understanding how costly it will be for societies to reduce emissions, and which policies will be most effective in prompting these changes?
By holding to the position that there’s no such thing as a free lunch, economists may be overestimating the true cost of mitigation. This could occur in top-down models because of failure to recognize that inefficient decision-making exists for individuals, industry, and governments, meaning that there are opportunities to reduce GHG emissions while lowering costs—a so-called “win-win.” The question is how pervasive are such opportunities. Whereas the economics IAMs assume there are none, the IPCC asserts that win-wins can account for up to 16% of emission reductions in 2030. But, as we have shown, the IPCC estimate omits a whole category of difficult-to-quantify nonmonetary costs. Given this wide range, we argue that more explicit communication and empirical evidence is necessary to provide greater clarity and resolution on the policy-relevant costs of mitigation.
To help set the research agenda, we provide a breakdown of sectors where the issue appears most important (see the second figure). In the four sectors where the IPCC reports costless mitigation, its magnitude is often a substantial portion of the full potential reported at any cost. This suggests that, in many cases, resolving the question of how much mitigation is costless is more important than refining estimates of the mitigation potential at costs >$0. This is particularly true in the energy, buildings, and transportation sectors.
We see several opportunities to move forward. First, as an institutional matter, the engagement of economists with the IPCC has been in decline, and efforts to promote greater involvement will help. The need for greater engagement goes both ways: climate scientists wanting to engage with economists, and vice versa. Economics is focused on the study of trade-offs, and the questions being raised here are about how best to quantify and communicate the trade-offs associated with reducing GHG emissions. Our experience is that some climate scientists rarely appreciate reminders of trade-offs when it comes to a problem rightfully viewed with an increasing sense of urgency. Nevertheless, without a clear-eyed view about the full costs (i.e., trade-offs) of addressing climate change, the community of researchers runs the risk of miscommunicating the scale of the challenge ahead and of drifting further away from the political realities of policy formulation and implementation.
Second, the literature on barriers to the adoption of mitigation and energy efficiency activities can be reoriented to play a more constructive role. Studies of particular programs aimed at reducing emissions often find actual costs that are substantially greater than anticipated. What is needed is a greater sense for what types of activities and in what sectors the gaps are likely to be small or large, and which ones might be especially important for scaling up to estimates on a global scale. Additionally, beyond documenting the gaps, more behavioral and social science research is needed on how they can be overcome and help inform real-world policies.
Third, research is needed with an eye toward reconciling seemingly conflicting results. Whereas studies of particular interventions or projects often find higher costs than expected according to bottom-up approaches, the opposite is true for many analyses of more general environmental and climate policies, for which realized costs are considerably less than expectations based on top-down approaches. Why? And what lessons can be learned for estimates of global marginal abatement costs? A plausible interpretation, suggesting a middle ground, is that bottom-up costs often need revising upward, whereas top-down costs often need revising downward.
Finally, the benefit-cost focused IAMs should be continually updated to reflect the latest empirical evidence on mitigation costs. An expanding literature on the monetary damages of climate change focuses on cross-validation and calibration between IAMs and bottom-up empirical estimates. Nevertheless, we are not aware of similar efforts that seek to cross-validate top-down mitigation cost assumptions with bottom-up empirical estimates. And yet, compared to the nonmarket effects of climate damages, the costs of mitigation are generally more observable and immediate, suggesting a promising avenue for improved estimation.
To conclude, the direct monetary costs of adopting mitigation activities is informative, but incomplete. It ignores real yet indirect opportunity costs that are potentially more difficult to measure. Distinguishing between these two notions of cost is helpful for interpreting and communicating different estimates coming out of the scientific community and for setting a research agenda to promote greater reconciliation.
This article was first published by Science.